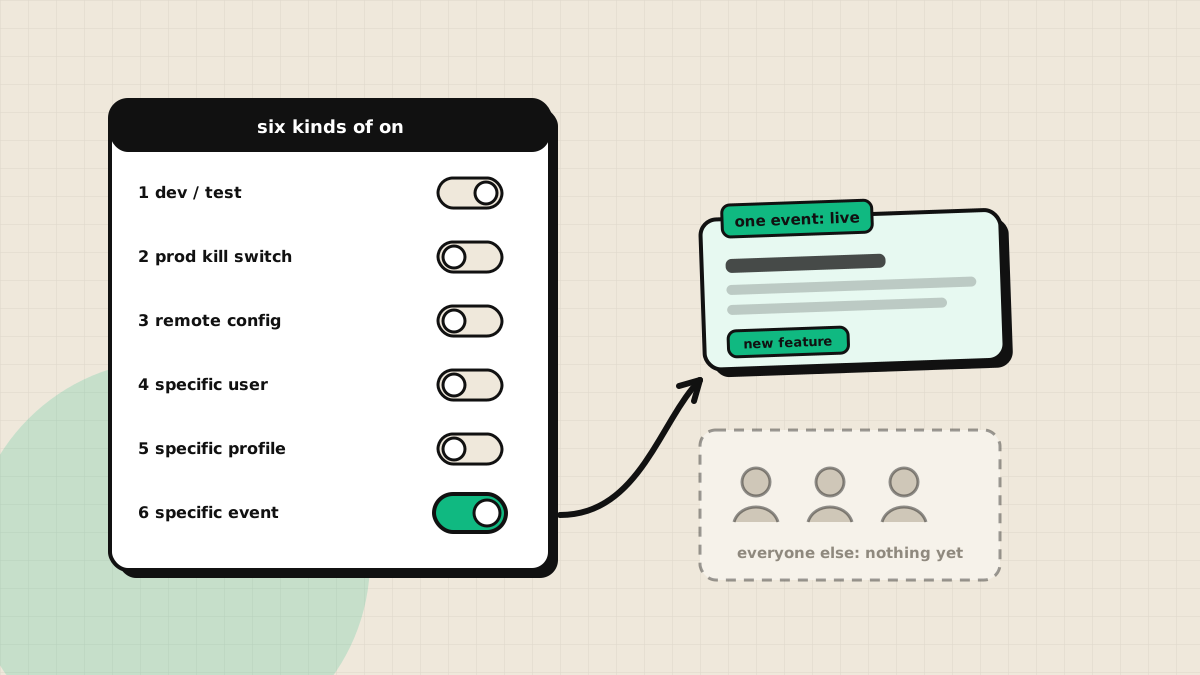
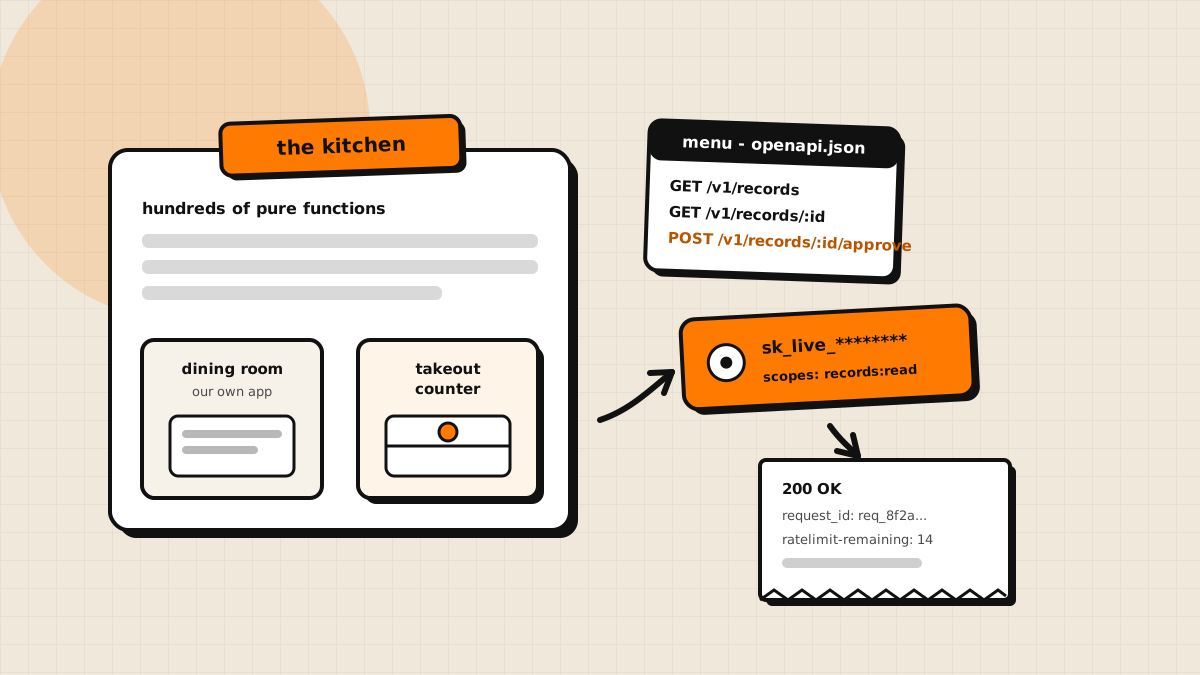
The short version
- After launch, every feature has to answer three questions: is it crashing (Sentry on web, Crashlytics on mobile), are people using it (PostHog on all three surfaces), and are they succeeding (funnels, session replay, Clarity heatmaps). One tool can't answer all three.
- Every custom event goes through one fan-out helper — a single call sends to PostHog and Firebase Analytics with environment gating, internal-user filtering, and enum-enforced event names. Call sites never talk to an analytics SDK directly.
- The unglamorous work is what makes the data trustworthy: separate analytics projects per environment, filtering your own team out, validating cross-domain session ids, and — because ad blockers eat tracking scripts — a watchdog that monitors whether the analytics tool itself is running.
Launch day is a hypothesis, not a result
The deploy finishes, the feature is in front of everyone, and that moment feels like the finish line. It's actually the start of the only test that counts: strangers, at scale, with nobody watching over their shoulder.
And at scale, the failure modes are quiet. Nobody files a bug for a confusing flow — they abandon it. A crash that hits 2% of devices never shows up in your own testing. A funnel that leaks at step three looks, from the inside, exactly like a funnel that converts.
So we treat instrumentation as part of the feature. Before anything reaches users, the feature's events, error context, and funnel steps are already wired. The launch doesn't produce a party; it produces dashboards we watch for two weeks. Three questions, three different kinds of tooling:
| Question | Web | Mobile | Backend |
|---|---|---|---|
| Is it crashing? | Sentry (replay + tracing, source maps) | Firebase Crashlytics | Structured logs + error taxonomy |
| Are people using it? | PostHog (posthog-js) | PostHog (React Native SDK) | PostHog (Node SDK) |
| Are they succeeding? | PostHog funnels + replay, Microsoft Clarity heatmaps | PostHog funnels | Server-side funnel events |
Three questions, three kinds of tooling
Is it crashing?
- webSentry — replay, tracing, source maps
- mobileFirebase Crashlytics
- backendstructured logs + error taxonomy
Are people using it?
- webPostHog (posthog-js)
- mobilePostHog (React Native SDK)
- backendPostHog (Node SDK)
Are they succeeding?
- webPostHog funnels + replay, Clarity heatmaps
- mobilePostHog funnels
- backendserver-side funnel events
Marketing attribution (Tag Manager, GA4, ad pixels) runs beside all of this, production-only — a different audience of dashboards answering a different question ("where did they come from"), and deliberately not the tooling we use to judge whether a feature works.
One helper, every destination
The first thing we standardized: call sites don't talk to analytics SDKs. They call one function.
logAnalyticEvent(EAnalyticEvent.TICKET_SELECTED, {
  flow_step: 2,
  price_tier: "early",
})
That helper owns all the routing decisions in one place:
- Internal users are dropped first. Team members are marked at login, and their events go nowhere — not to product analytics, not to the ad pixels. Your own QA clicking through a new feature fifty times looks exactly like adoption if you let it.
- Dev sends nothing. In development the helper logs a warning and returns. There is no "dev data, we'll filter it later" — later never comes.
- Staging and production are separate analytics projects entirely. Not a property to filter on — different projects, different API keys per env file. Staging sessions can never pollute production dashboards, and every event still carries an
environmentproperty so a stray one is attributable. - One event name fans out everywhere. The same call captures to PostHog and, for identified users in production, Firebase Analytics. One name, defined once, in one enum.
One helper, every destination
- Internal user?Dropped. Your own QA clicking fifty times looks exactly like adoption.
- Dev environment?Logs a warning, sends nothing. There is no "we'll filter it later."
- Staging or production?Separate analytics projects, separate API keys — and an environment property stamped on every event anyway.
PostHog
every surface — web, mobile, backend
Firebase Analytics
identified users, production only
The enum part sounds like pedantry and isn't. Event names are an API between you and your future self: ticket_selected and select_ticket and ticketSelected are three events no funnel can join. Every event name in our codebase comes from a shared enum — snake_case, verb included, no string literals at call sites. The compiler now enforces what a style guide used to beg for.
Funnels: where "people like it" becomes a number
A funnel is just an ordered list of events with honest names. Our purchase funnel on the web:
landing → details_viewed → ticket_selected → questionnaire_filled → checkout_started → payment_attemptEach step is one enum event, fired from one place. PostHog assembles the funnel and shows the drop-off between every pair of steps — and that drop-off chart is the single most useful artifact for the "is the flow good?" argument, because it replaces opinions with a number. When a step leaks 40% of the people who reach it, the debate about whether the flow is confusing is over; the only question left is what to fix.
The purchase funnel — try the filter
- landing
- details_viewed
- ticket_selected40% of arrivals leak here
- questionnaire_filled
- checkout_started
- payment_attemptcarries status: success / failure / error
the real funnel — now the leak is visible and fixable
Two details that made our funnels trustworthy:
- The last step carries its outcome.
payment_attemptfires with astatusof success, failure, or error, plus method and amount. A funnel that ends at "reached checkout" flatters you; a funnel that ends at "money moved, or didn't, and here's why" tells the truth. - Backend steps fire from the backend. Payment confirmations and refunds don't depend on a browser tab staying open. Server-side events (sent via the Node SDK and the GA Measurement Protocol) carry the steps the client can't be trusted to report.
Page-to-page movement, meanwhile, costs nothing: PostHog autocaptures pageviews on every URL change in the SPA, so "where do users go after this screen" is a query, not an engineering task. The paths users actually take through a new feature — not the path the design assumed — regularly decide what we build next.
The chunk-load trick: making an error visible to analytics
My favorite small hack in this whole system. Single-page apps load code in chunks, and every deploy invalidates old chunk names — so a user with a stale tab clicks something and the import fails. The fix is easy (reload the page). The visibility was the interesting part: we wanted those incidents in analytics, in the same place as the user's journey.
So the error handler briefly rewrites the URL:
// Record a synthetic pageview at /chunk-load-error so the incident
// lands in PostHog's autocapture, attached to this user's session...
window.history.replaceState({}, "", pathname + "/chunk-load-error" + search)
// ...then restore the real URL and reload to fetch fresh chunks.
window.history.replaceState({}, "", pathname + search)
window.location.reload()
An error disguised as navigation
- /event/123A stale tab clicks after Tuesday's deploy — the old chunk is gone and the import fails.
- 2/event/123/chunk-load-errorpageview capturedThe handler briefly rewrites the URL. Autocapture records a synthetic pageview, attached to this user's session.
- 3/event/123The real URL is restored — nothing user-visible changed.
- /event/123Reload fetches fresh chunks and the user continues. The incident is now a PostHog query.
The pageview autocapture does the rest. Now "how many users hit stale chunks after Tuesday's deploy" is a PostHog query showing exactly which pages it happened on — no new event type, no separate dashboard. Sometimes the best instrumentation is making an error look like navigation.
PostHog customizations that earned their keep
Out of the box, PostHog gets you far. These are the modifications that turned out to matter:
- A key-prefix guard on the snippet. The loader only runs if the injected API key actually looks like a PostHog key. A missing env var in some build means analytics silently off — never a snippet crashing the page or events going to a garbage project.
- Cross-domain session stitching, with validation. Our marketing site and the product are different domains; outbound links carry the visitor's analytics ids, and the product bootstraps PostHog with them so one person doesn't become two. The part we learned the hard way: validate what arrives. Session ids that aren't well-formed UUIDs — placeholder strings, truncated params, creative user editing — get discarded with a console warning, and a fresh session starts. Garbage ids silently adopted had been quietly corrupting session analytics.
- Debounced interaction tracking. Naively instrumenting a search box sends an event per keystroke. Our search-tracking hook debounces 600ms, truncates long queries, and keeps a dedupe key so re-renders can't re-fire the same query. What reaches the dashboard is "what did people search for," not "how does React render."
- Serverless capture that actually sends. Cloud functions can freeze the instant the response ends — batched analytics events die in the buffer. Backend captures use the immediate-send path, awaited with a 1.5-second cap, and an analytics failure never fails the user's request. Each backend event carries a small error taxonomy (
rate_limit,forbidden,api_error,unexpected) instead of error text, so dashboards can group failures without ever ingesting message contents — which is also the PII rule: ids and enums travel, free text and payloads don't.
Watching the watchers
Session replay is the tool that settles "users don't understand it" debates — you watch five replays of real people meeting your feature and the confusing part announces itself. We run PostHog's replay plus Microsoft Clarity, which adds heatmaps and its own replays, and whose rage-click detection finds the button users think is broken.
But analytics scripts are exactly what ad blockers block, and a tracking tool that silently fails reports nothing — including the fact that it failed. For a while our Clarity data had holes nobody could explain. Now a monitor hook checks whether Clarity actually initialized, on mount and again 30 seconds later, and when it hasn't, logs a diagnostic bundle: script tags present, whether the script loaded from the network, storage availability, page context. When it recovers, it logs that too.
It sounds absurd — observability for the observability — until the first time the diagnostics tell you why a chunk of your data is missing (a specific script failed to load, in a specific browser, behind a specific blocker) instead of leaving you to treat a measurement gap as a user-behavior change.
The error side: from alert to verified fix
Behavior data says whether users succeed; the error stack says whether the code does.
- Web: Sentry initializes in production and staging with tracing and session replay. The Vite build uploads source maps, so a production stack trace points at real TypeScript — a minified
t is not a functionis a stack trace you'll never act on. Sentry's replay attaches the user's last moments before the error; paired with breadcrumbs, most reports arrive pre-reproduced. - Mobile: Crashlytics, because the mobile failure mode is different — crashes are fatal, device-and-OS-specific, and clustered. Crash-free-session rate per release is the number that decides whether a rollout continues.
- Backend: structured logs with contextual fields and no PII, plus one rule we enforce everywhere: any time a guard turns a request away, it logs the reason. A silent rejection is indistinguishable from an outage.
The loop closes the same way every time: the alert names the release and the stack; the replay shows the user's path; the fix ships; the same dashboard that caught the bug confirms the fix. Then — only then — the launch retro happens with charts in it.
What went wrong before this worked
- Our own team was our biggest user. Early numbers on a new feature looked great until the internal-user filter shipped and adoption dropped by... a lot. Filter yourselves out on day one.
- One environment's data poisoned another's. Dev experiments and staging QA runs inside the production analytics project meant every query started with "filter out the noise." Separate projects ended that class of problem permanently.
- We trusted a single pipeline. Ad blockers took out a slice of client analytics and we read the dip as a behavior change. Overlapping tools (PostHog and Clarity, client events and server events) plus the watchdog turned "mysterious dip" into "measurable collection gap."
- Stale-chunk errors masqueraded as feature bugs. Post-deploy error spikes kept implicating whatever launched that day, until the chunk-load detector separated "your code is broken" from "their tab is old."
Steal my workflow
- Wire instrumentation before launch: the feature's funnel steps, error context, and replay coverage ship with the feature, not after it.
- Route every event through one helper that owns env gating, internal-user filtering, and user context. Ban direct SDK calls at call sites.
- Put event names in a shared enum — snake_case, verb plus entity — and reject string literals in review.
- Define each funnel as an ordered list of those enums, end it at a step that carries its outcome, and fire money-adjacent steps from the server.
- Keep environments in separate analytics projects and stamp every event with an
environmentproperty anyway. - Run replay (and a heatmap tool) alongside event analytics — numbers find the leak, replays explain it.
- Monitor your monitoring: a watchdog for script initialization, and overlapping pipelines so one blocked tool isn't total blindness.
- Upload source maps, watch crash-free rates per release, and close every incident by verifying the fix in the same dashboard that caught it.
FAQ
Because the questions are genuinely different. Error tracking needs stack traces and release health; product analytics needs identity and funnels; replay needs DOM recording; attribution needs ad-platform plumbing. Tools that claim all four do one well. The real cost isn't the tool count — it's unrouted events, which the fan-out helper solves.

Written by
Rushit Jivani
Senior Software Architect & AI Application Engineer. Architecture that shows up in crash rate, performance and how fast the team ships.